From market signals to actionable intelligence
Decode Patterns. Connect Signals. Uncover Opportunities.
Diverse Lenses. One Unified Strategic View.
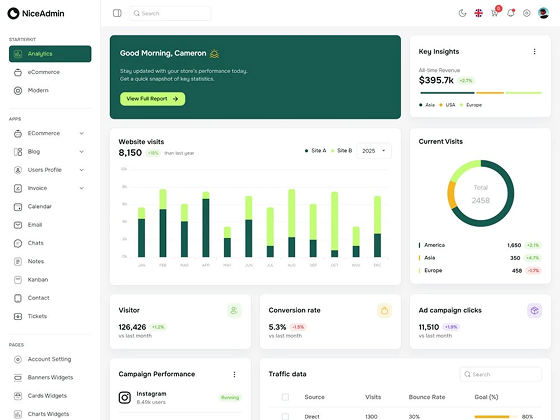
Track signals that shape strategic decisions. From IP to customer sentiment and emerging trends, our dashboards bring critical intelligence together in one integrated view.
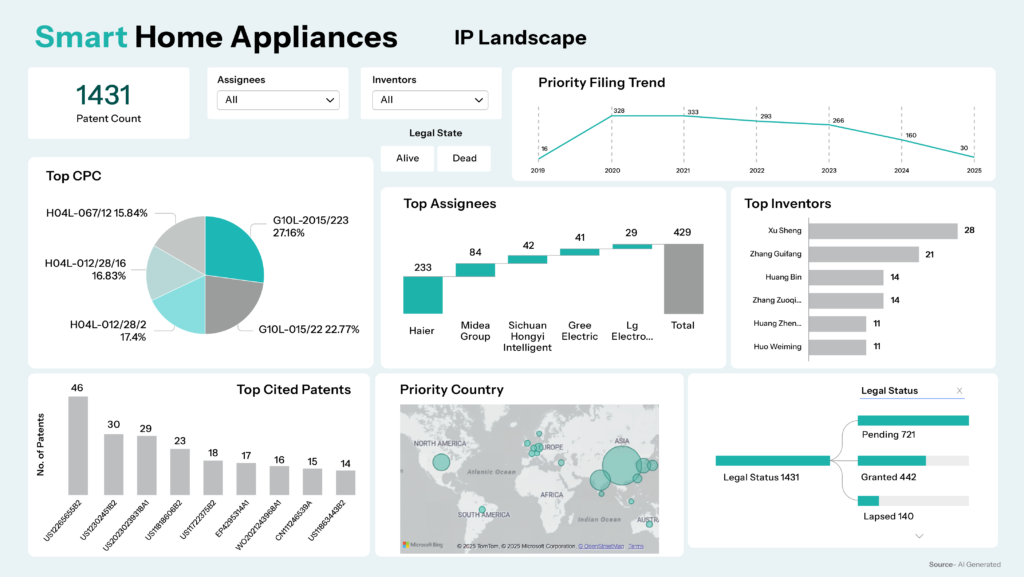
A single interactive view for clear visibility into portfolio strength, risk exposure, competitive filing trends, IP activities, and whitespace opportunities.
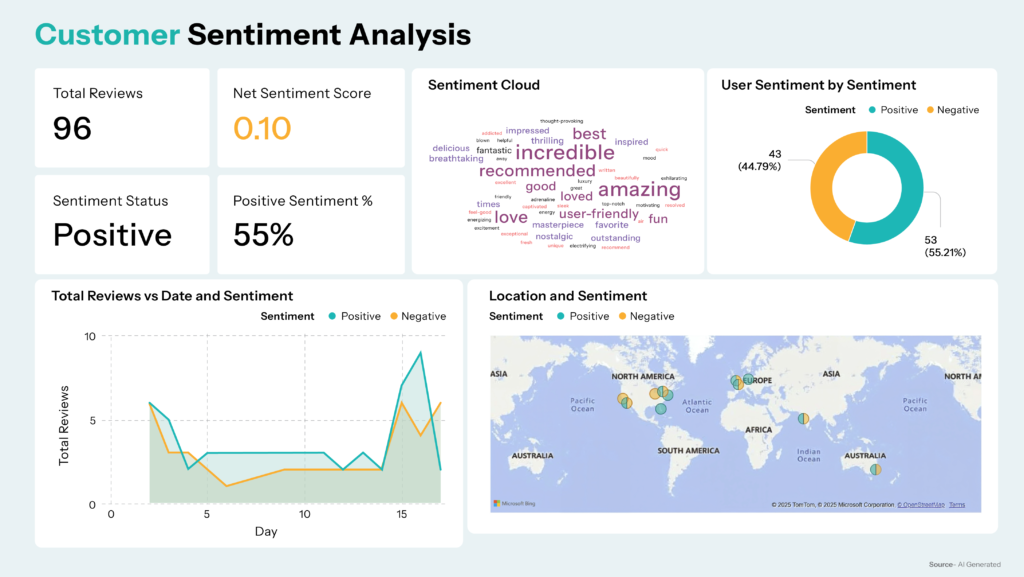
Consolidated, trusted view of customers’ perception through unified sentiment tracking across touchpoints to identify brand satisfaction and emerging signals for timely action.
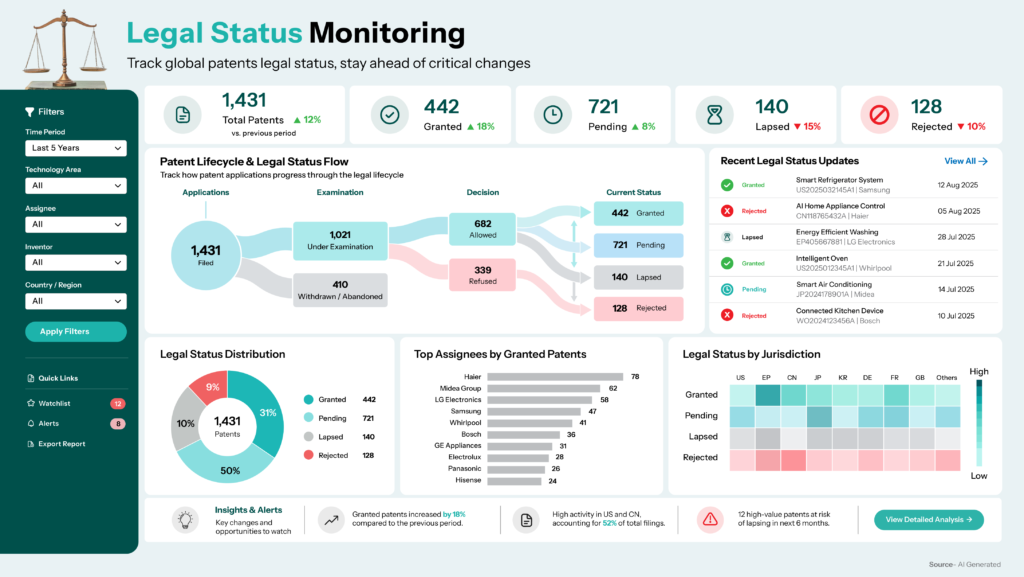
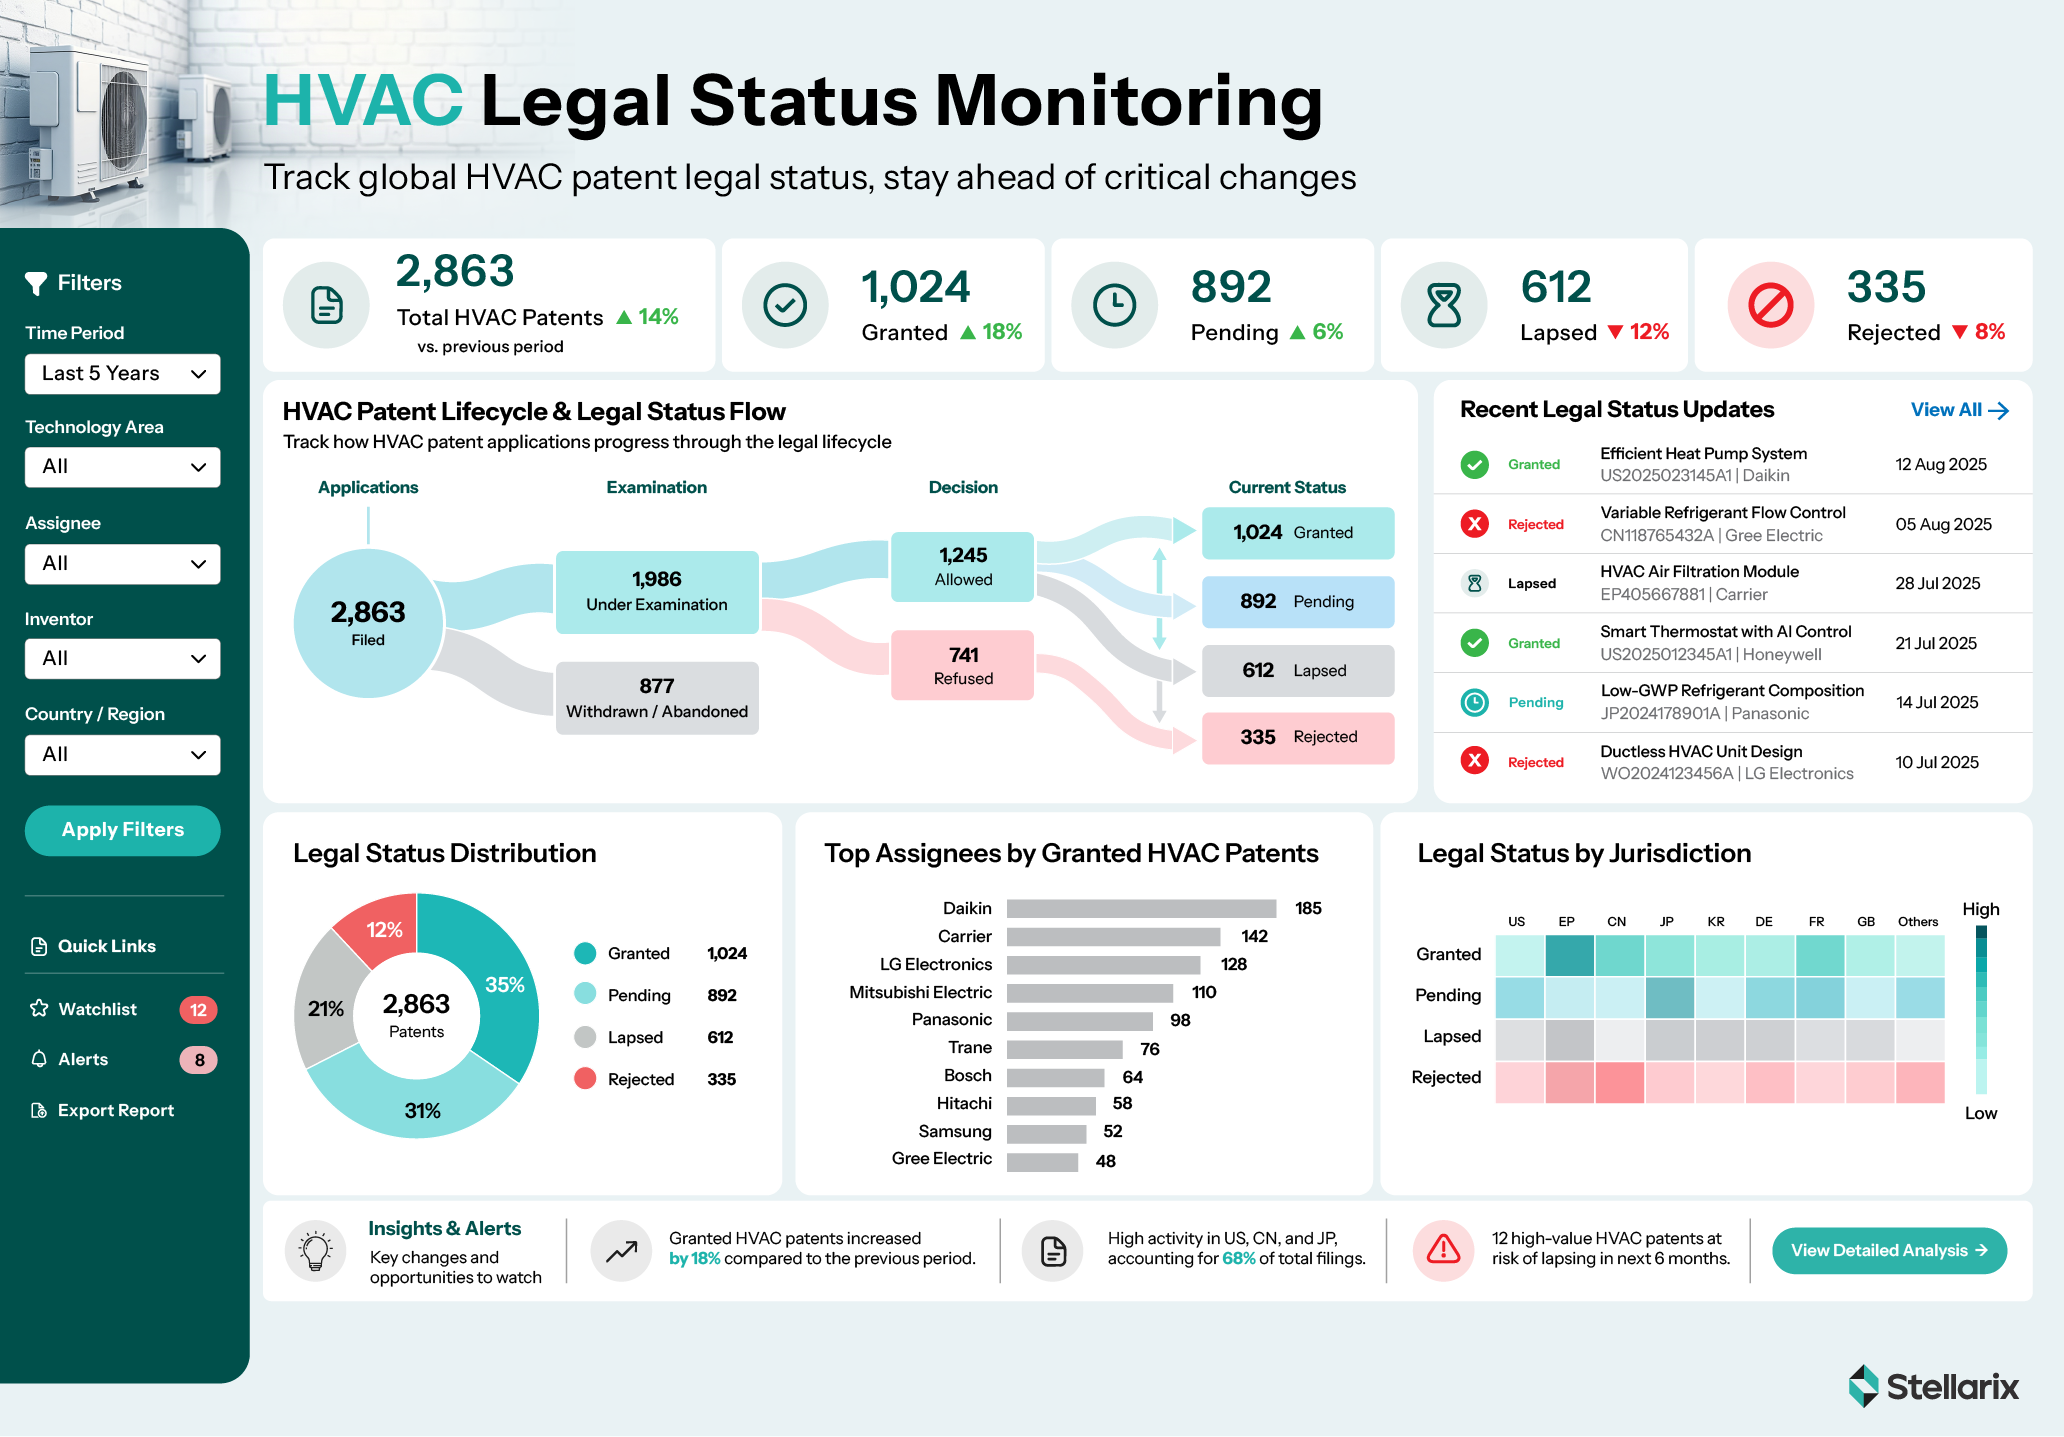
Track patent-related legal updates, case statuses & compliance deadlines in real-time to eliminate blind spots and maintain organizational agility.
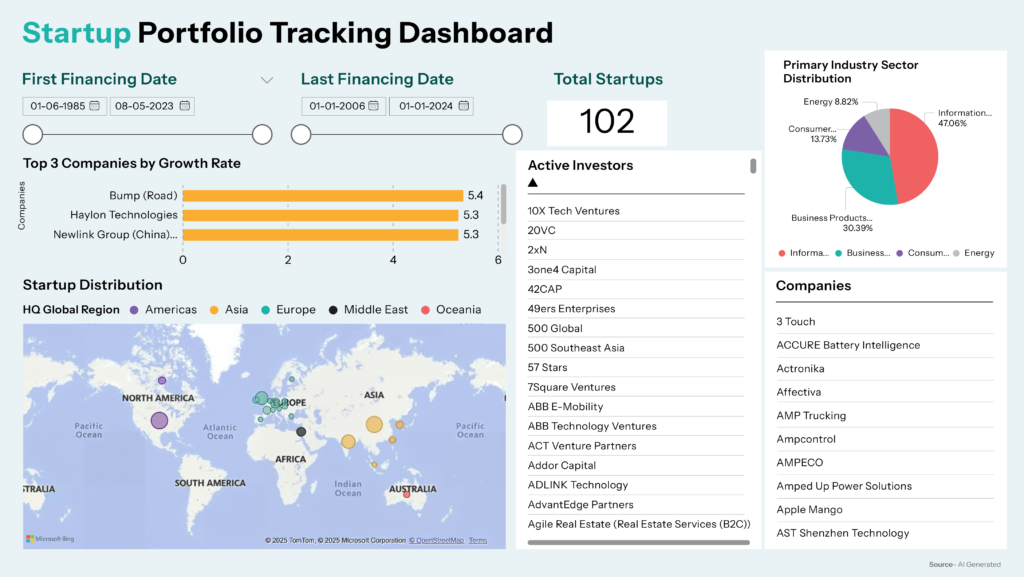
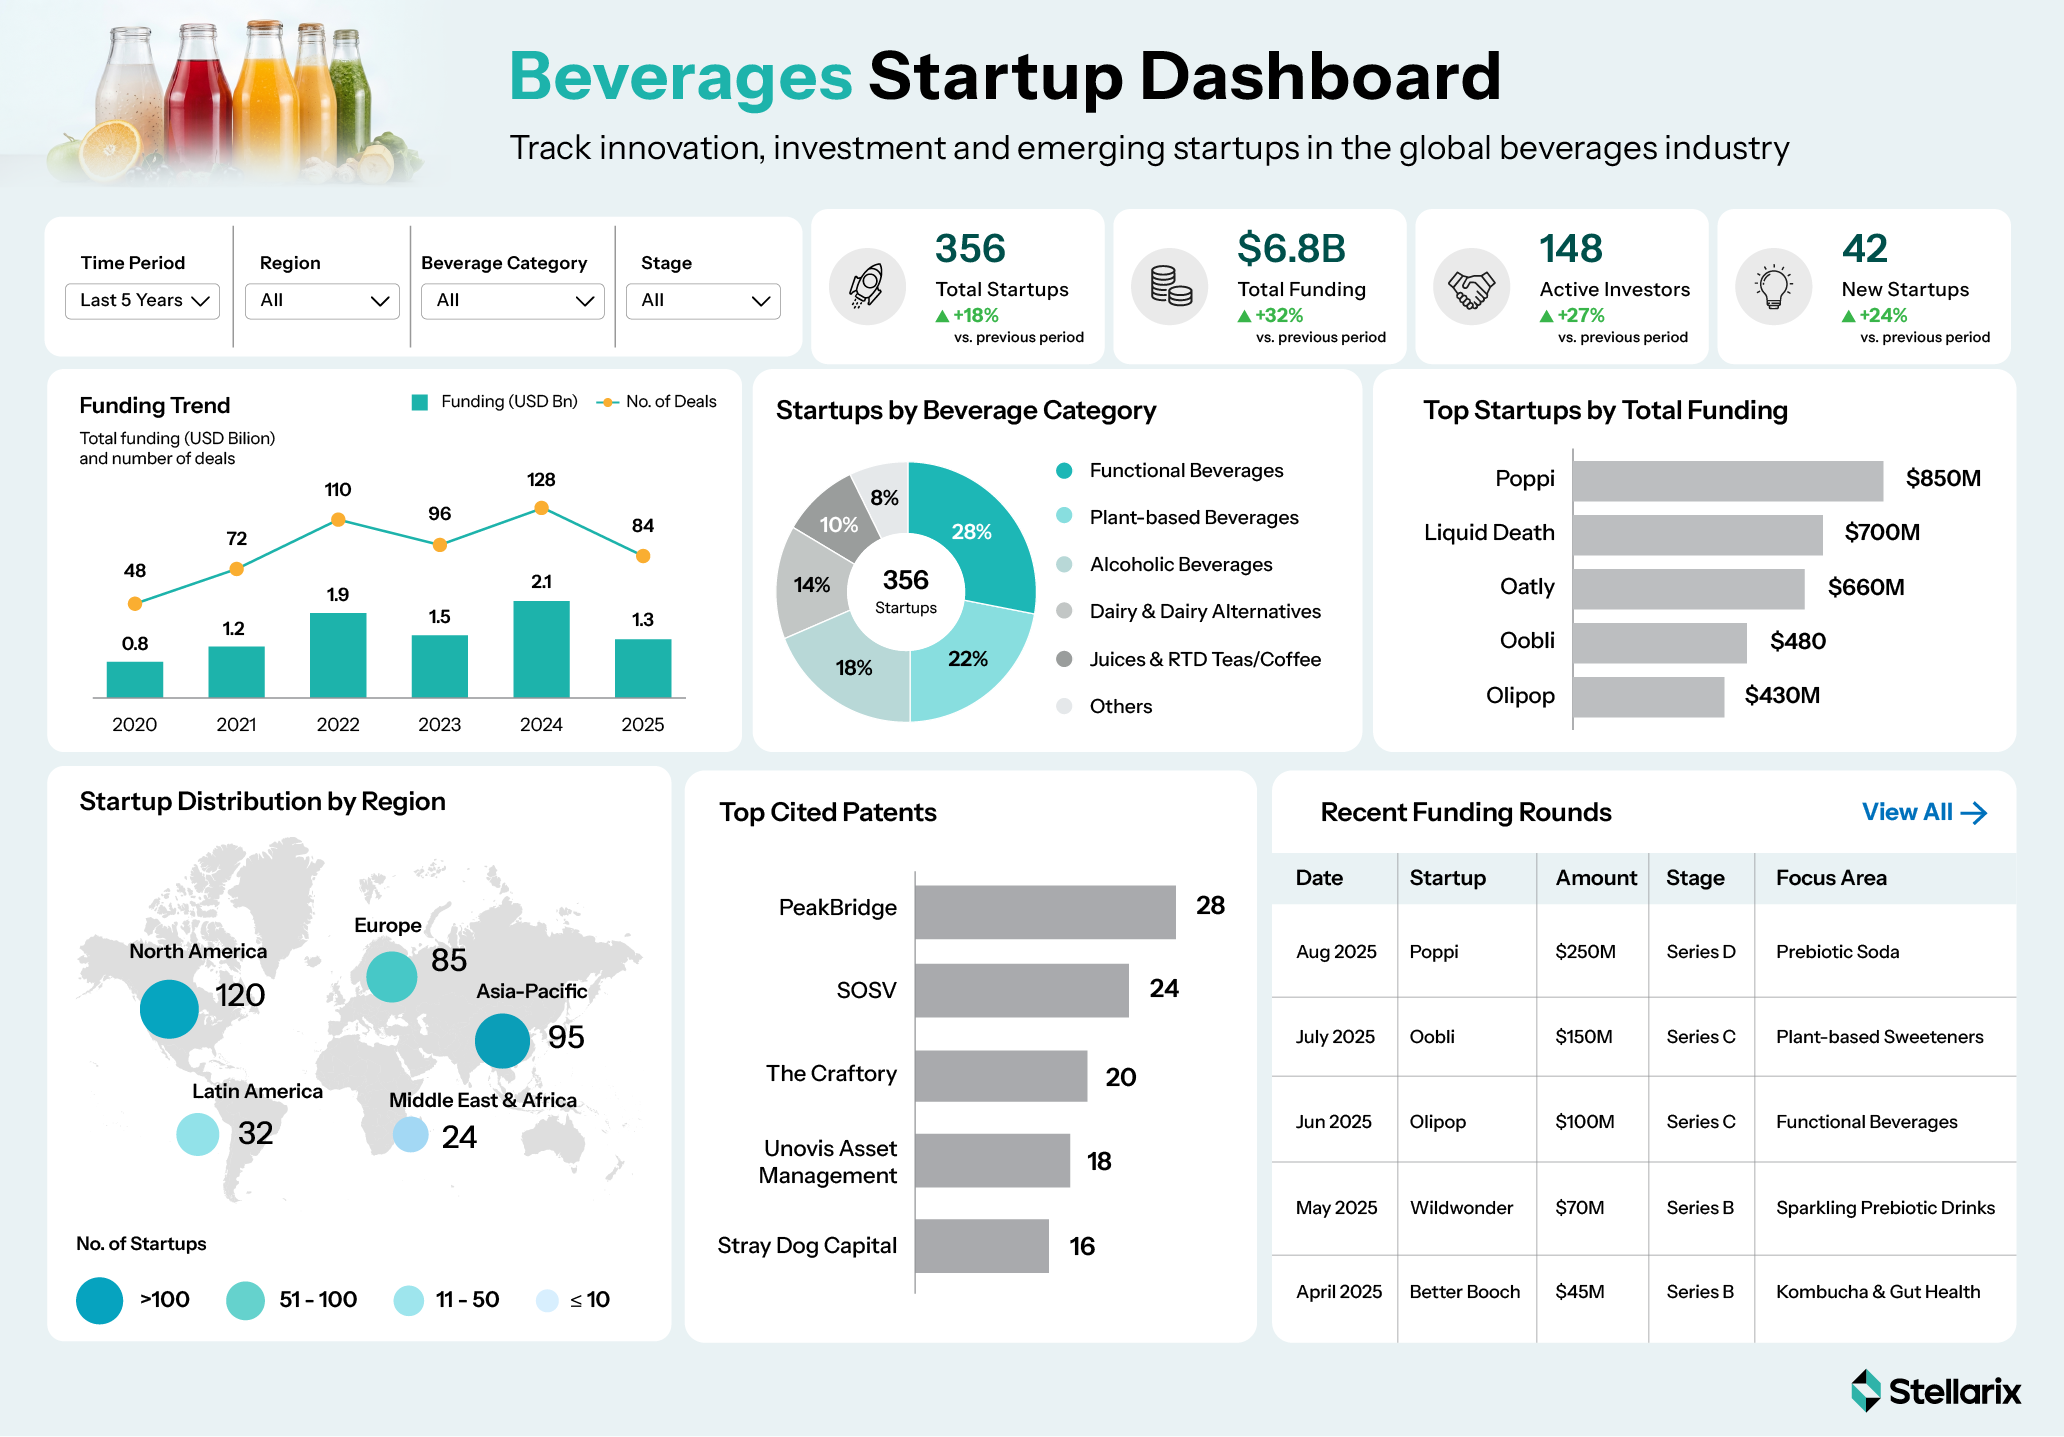
Continuous monitoring of the start-up ecosystem network to produce a unified view for key insights into the right startups, technologies, funding trends, and potential partners.
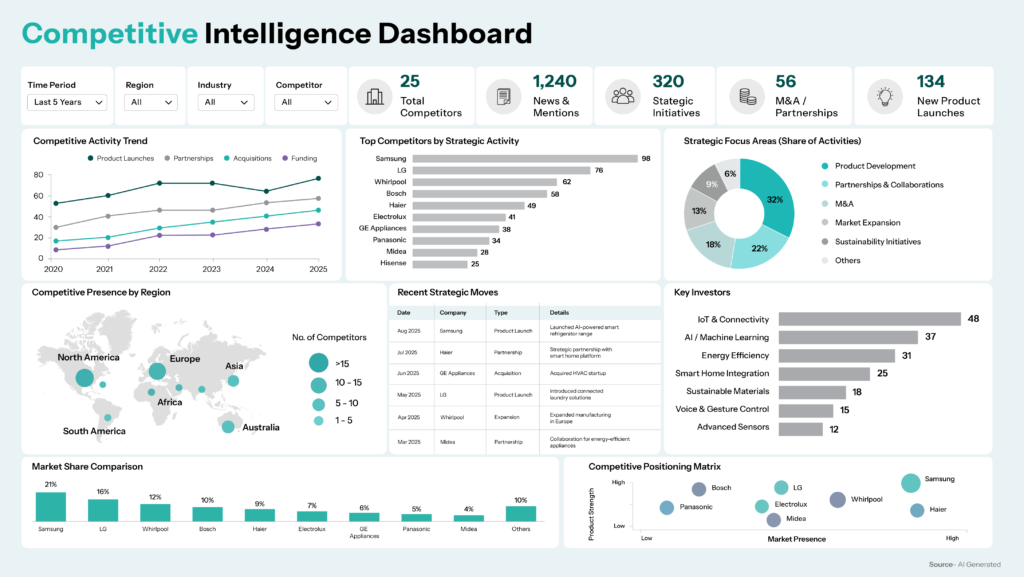
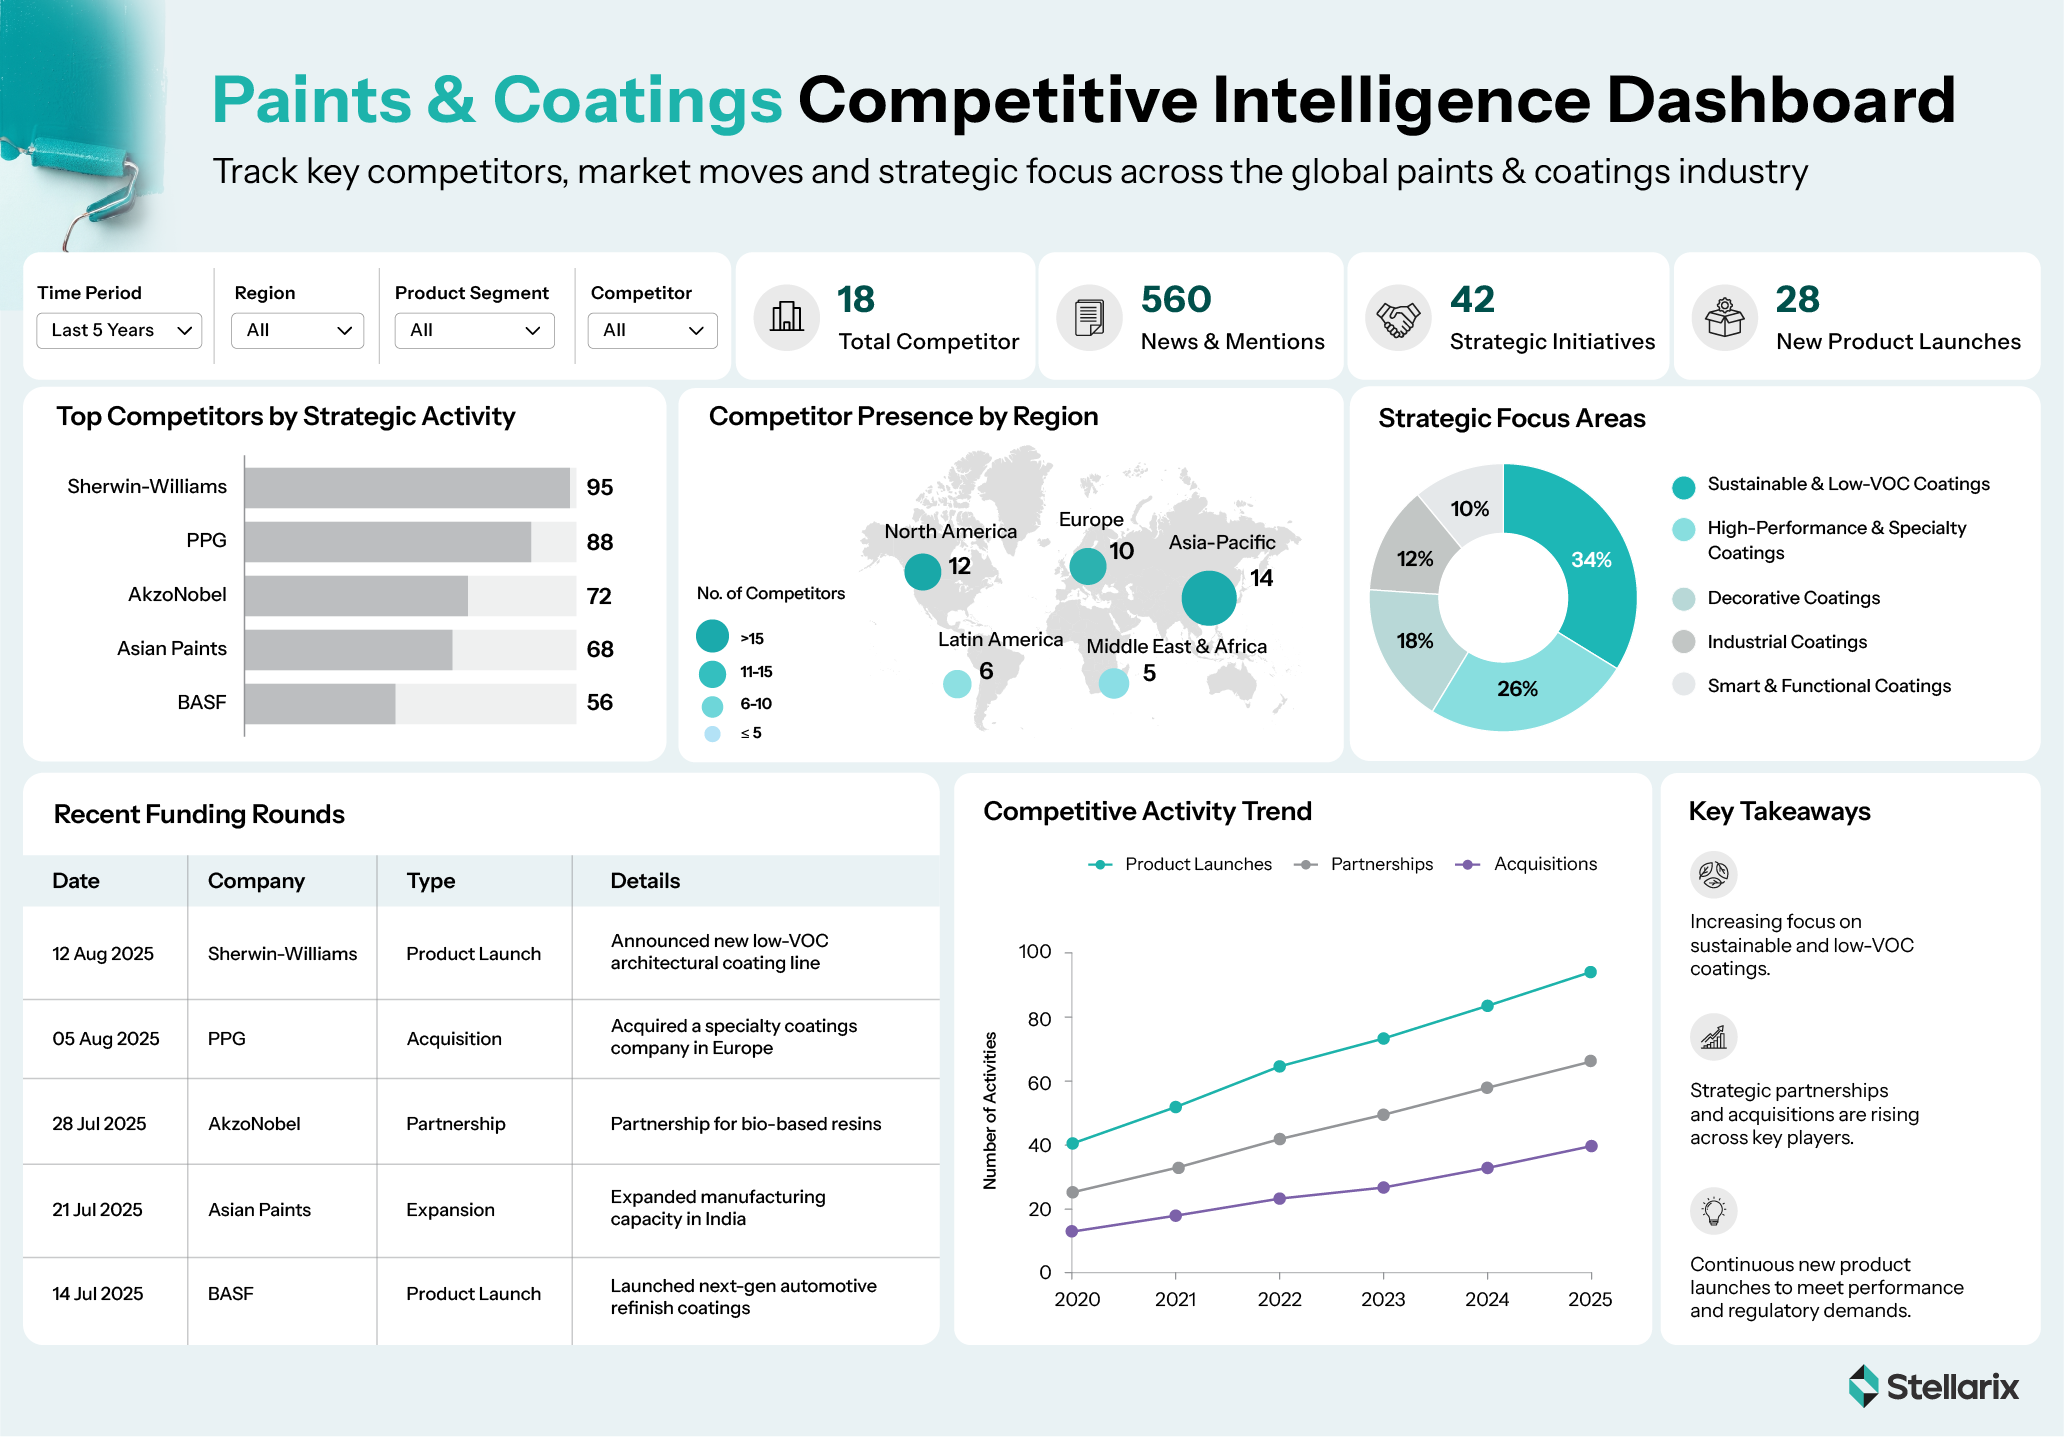
Provides thorough competitor insights on products, pricing, partnerships, and strategies to enable early, decisive action.
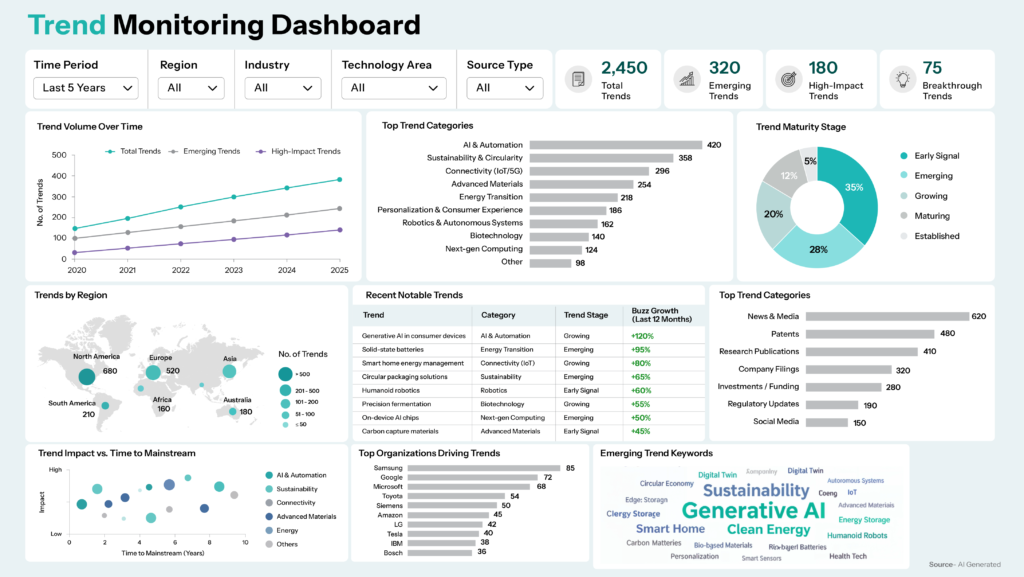
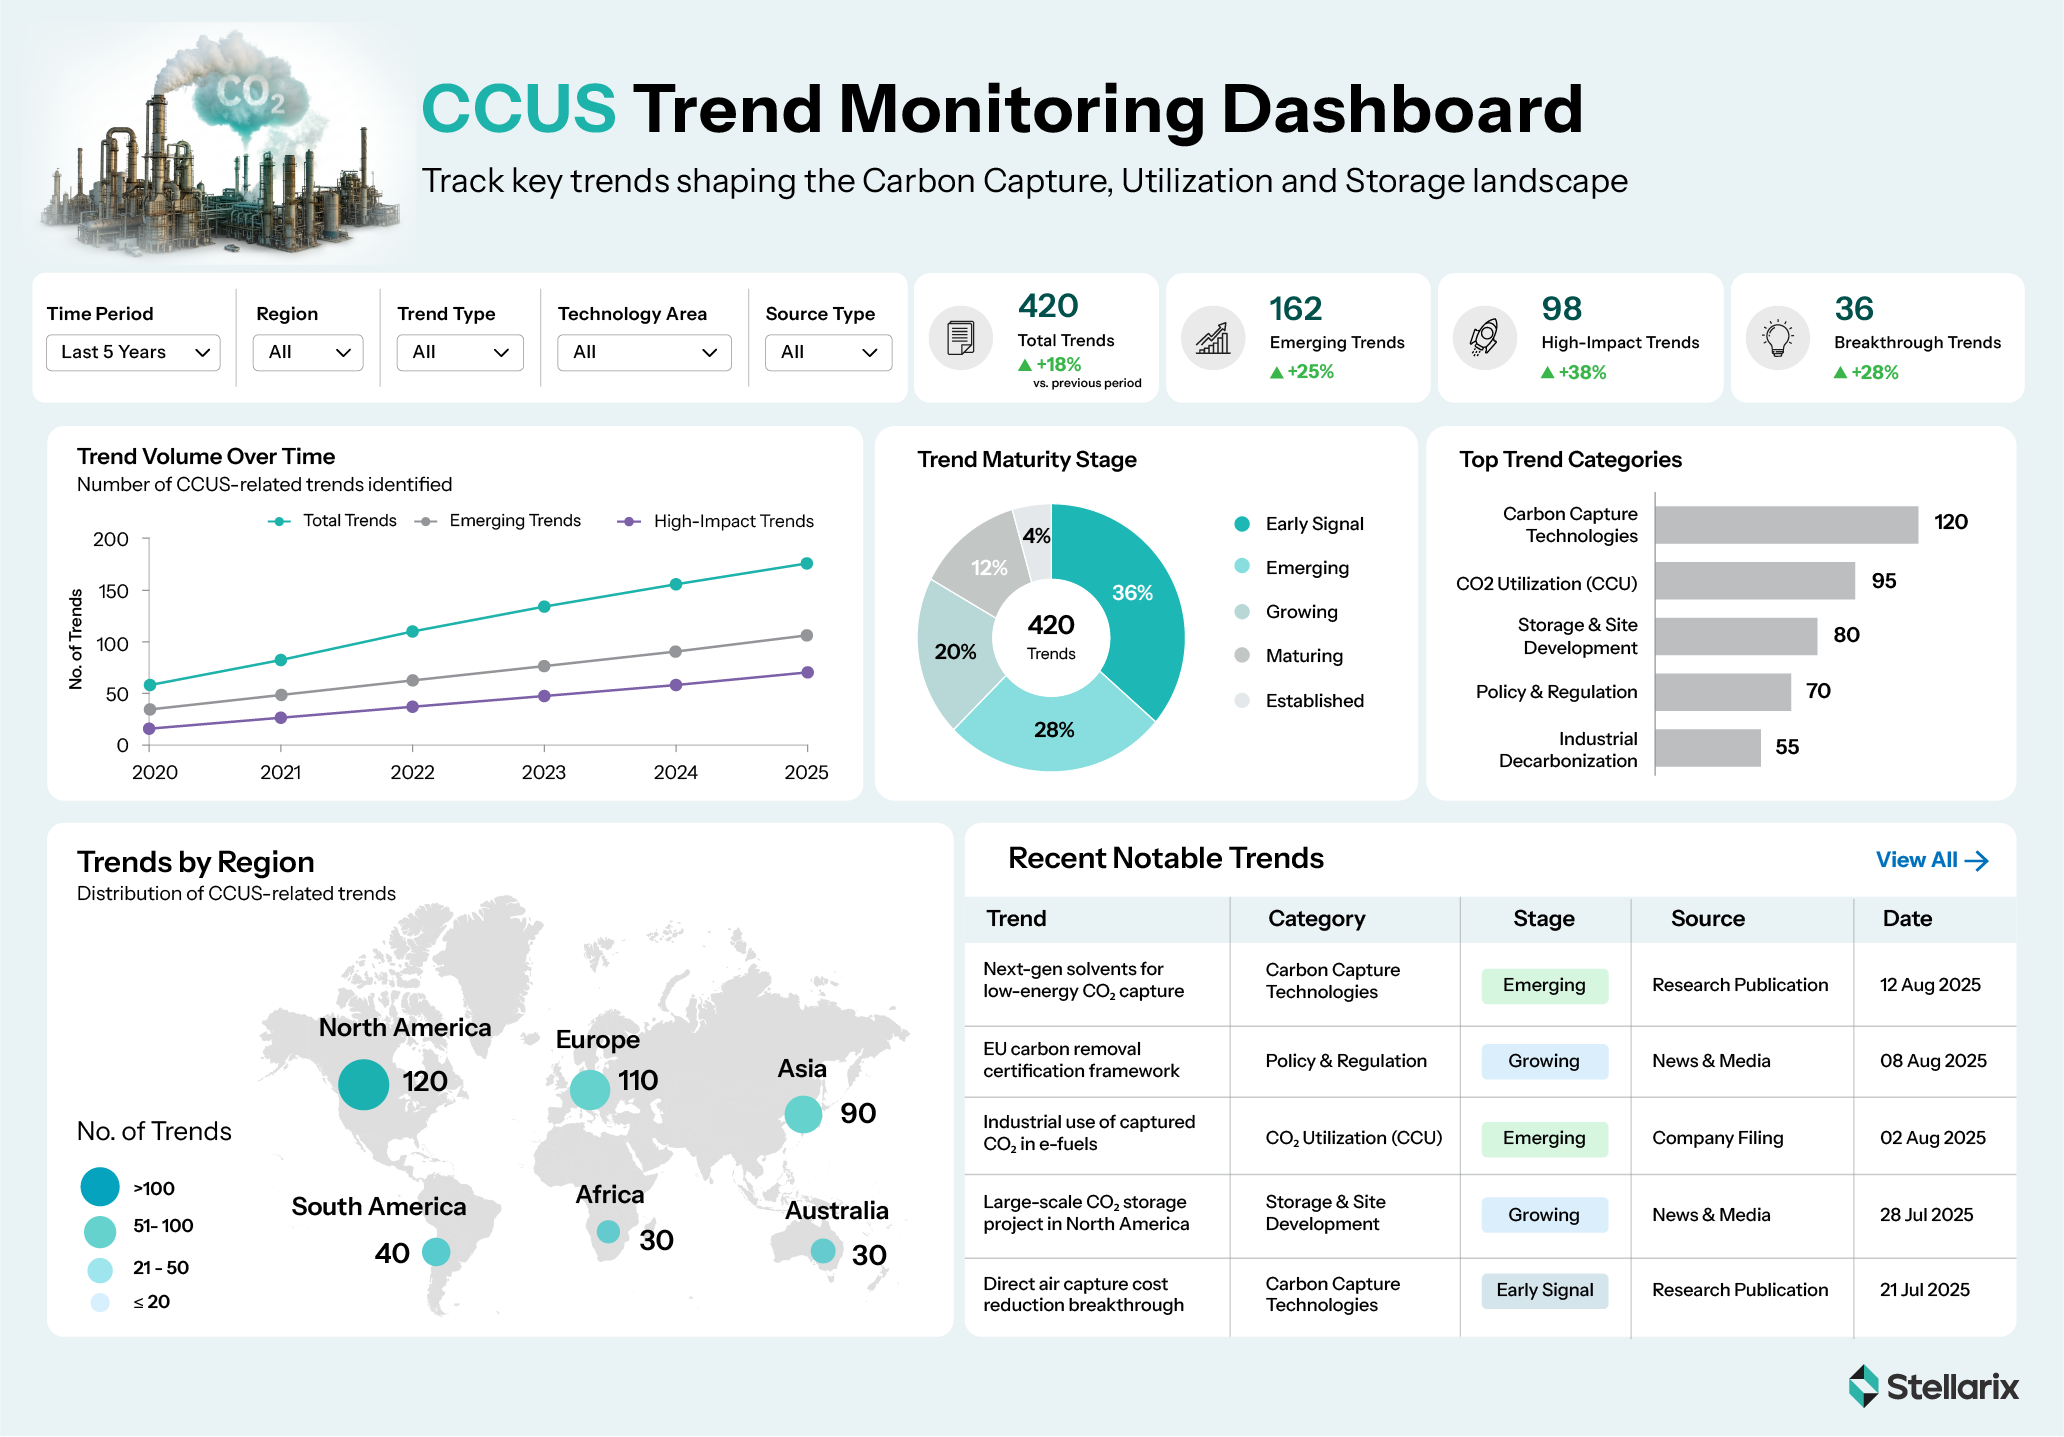
Brings emerging market, consumer, and technology trends into a single view to support fast and confident strategic decisions to help businesses stay ahead of the curve.
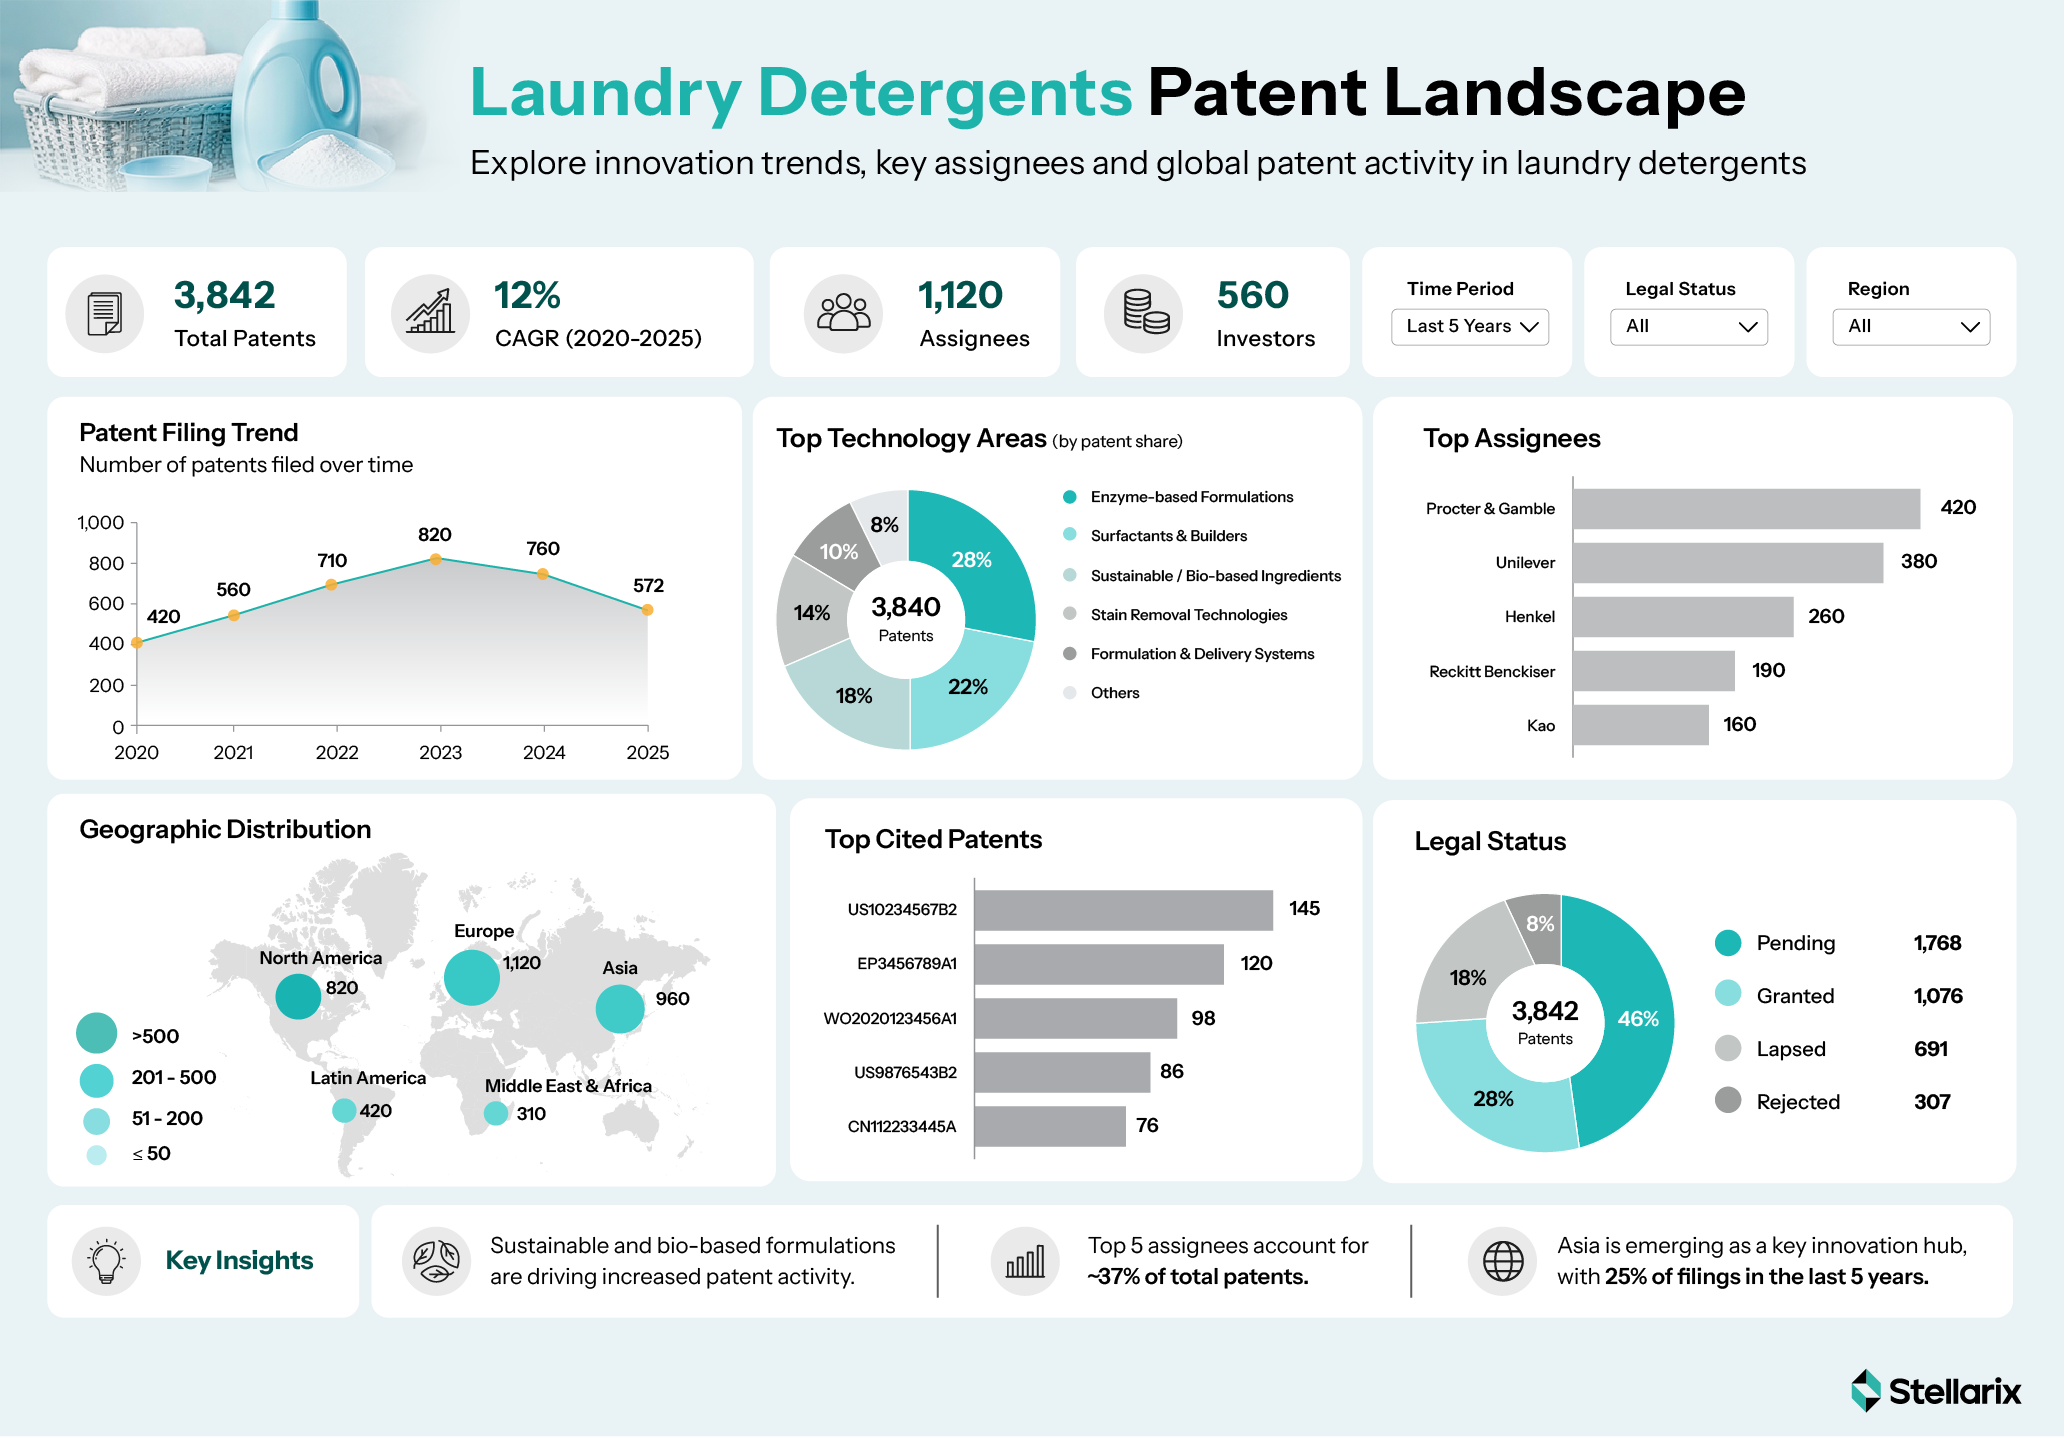
Dashboard Features
Consumer Packaged Goods
Unlimited access to our visualization platform
Tailored monthly reports on the entire CPG value chain from product development to consumer engagement
Access raw CPG data from pricing intelligence to retailer-specific metrics in Excel
Dynamic charts and filters for data analysis
Insights on whitespaces, competition analysis, and emerging trends curated by subject matter experts
Food & Beverage
Customized monthly reports on the entire value chain from raw materials to distribution
Insights curated by subject matter experts on emerging food pipelines, innovation, and sustainability
Unlimited access to our visualization platform
Access raw food and beverage industry data in Excel
Dynamic filters and charts for data analysis
Industrials & Mobility
Unlimited access to our visualization platform
Dynamic filters and charts to analyze data from the number of patents filed to commercial adoption
Tailored monthly reports on the complete industrials and mobility value chain
Access raw industrial and mobility data in Excel
Insights on whitespaces, competition analysis, and emerging trends curated by subject matter experts
Technology, Media & Telecom
Monitor all developments, from digital transitions to tech adoption curves, on one visualization platform
Filter by filing trends, technology maturity, funding, and competitive positioning
Tailored monthly reports covering infrastructure, platforms, devices, and enterprise services
Insights on whitespaces, competition analysis, and emerging trends curated by subject matter experts
Unlimited access to our visualization platform
Medical Devices and Technology
Tailored monthly reports covering everything across the entire medtech value chain
Unlimited access to our visualization platform
Access to raw medtech data in Excel, including device registries, deal tracking, and funding and stock movements
Insights on whitespaces, competition analysis, and emerging trends curated by subject matter experts
Dynamic filters and charts for data analysis
Energy
Tailored monthly reports on technology maturity, levelized costs, and pilot deployment pipelines
Monitor carbon intensity, regulatory compliance, and carbon credit pricing
Map capital allocation and Materials, Feedstock & Energy supply-chain risks
Access raw energy industry data in Excel on capital allocation and materials, feedstock & energy supply-chain risks
Dynamic filters and charts to analyze data
Chemicals & Materials
Unlimited access to our visualization platform
Tailored monthly reports tracking everything from green chemistry adoption to recycled content premium and carbon footprint metrics
Dynamic filters and charts for data analysis
Access unfiltered data in Excel on feedstock price spread, chemical restriction exposure, specialty acquisition targets, etc
Insights on whitespaces, competition analysis, and emerging trends curated by subject matter experts
Life Sciences
Insights on whitespaces, competition analysis, and emerging trends curated by subject matter experts
Dynamic filters and charts to analyze data
Unlimited access to our visualization platform
Customized monthly reports covering everything from R&D to patient access across the value chain
Access raw life sciences data in Excel
What the Dashboard Delivers
Unlimited Platform Access
Real-time, 24/7 visibility into customized intelligence reports
Dynamic Filtering & Interactive Visualizations
Intuitive filters and charts to segment data by timeline, geography, value-chain node, or technology
Tailored Monthly Reports
Customized, executive-ready deep dive reports specifically aligned to your KPIs and priorities
Raw Data Export in MS Excel
Full transparency with downloadable granular-level datasets
Dedicated Account Management
A single strategic point-of-contact for seamless onboarding and continuous alignment
Direct Access to Subject Matter Experts
On-demand consultation with industry specialists

FAQs
What Kind Of Data Does This Dashboard Use?
This dashboard utilizes primary and secondary data, including patent filings, regulatory updates, consumer reviews, credible news feeds, market reports, and industry databases sourced from both proprietary and public sources. Each dataset undergoes validation and is regularly refreshed to ensure relevance, authenticity, and accuracy.
What Kind Of Intelligence Is Available?
The range of intelligence services available includes IP management, customer sentiment analysis, startup monitoring, legal status monitoring, competitive intelligence, and trend analysis. These services encompass the analysis of competitor movements, IP portfolios, market trends, shifts in customer perception, legal status, and startup ecosystem activities. The dashboard provides insights into risks, identifies white-space opportunities, and delivers early warning signals to inform strategic decision-making.
How Can I Get Started With The Platform?
Our team commences with an initial discussion to understand focal areas and your business objectives. The Power BI dashboard is then configured and integrated with pertinent data sources. A pilot version is subsequently shared for feedback prior to full deployment.
How Can This Platform Help My Company?
The platform consolidates external intelligence, competitor activity, market shifts, IP risks, and emerging signals into a single source. Teams gain a shared view of the business landscape, enabling faster, more confident decisions, fostering resilience, and reinforcing strategic clarity by eliminating the need to switch between multiple sources.
How Does Stellarix Source This Intelligence?
Stellarix gathers this intelligence from proprietary databases, licensed sources, and public repositories that are curated and contextualized by domain experts. The outcome is actionable intelligence, not just raw data.
Can The Dashboard Be Customized For My Industry Or Requirements?
Yes. The dashboard is configured to reflect your key business priorities, the competitive landscape, and overall focus areas. Data sources, visualizations, alerts, and reporting frequency are all customized to your unique preferences.
Sharper Insights, Stronger Decisions.
Mental disorders are a significant global health issue impacting millions of people across the world.…
The field of vision care is undergoing transformation and has been better supplemented through artificial…
The derma care industry encompasses a wide range of products, treatments, and services focused on…
Maternal health has still been an issue all over the world as many women continue…
In an age when technological advancements are driving changes in every sphere of human life,…
Obesity is a condition in which immoderate fat accumulates in the body, causing health risks.…